Step By Step Tutorial
Lotto Analyzer 
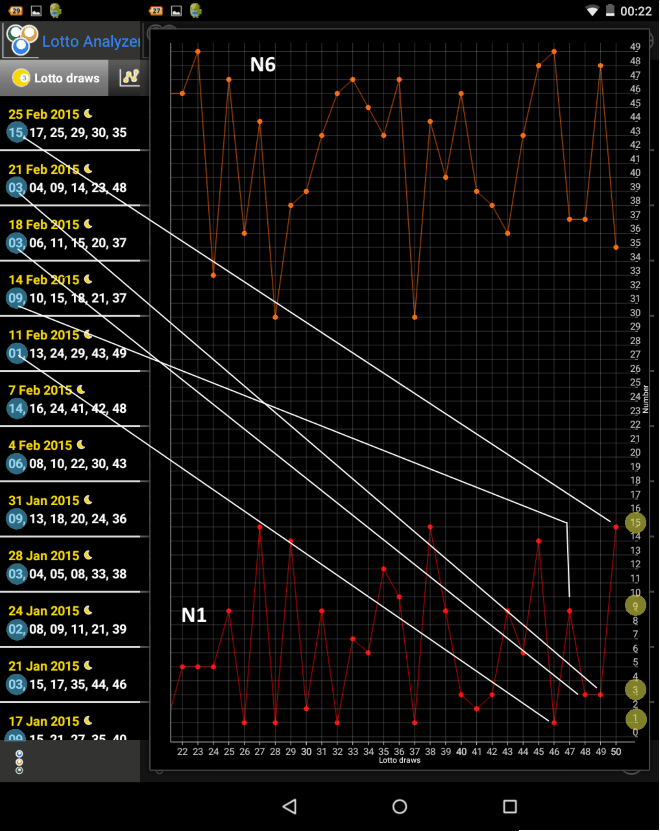
TREND using the Line Chart
Legend: N1 = first winning number; N2= second winning number; N3 = third winning number etc.
Notice how the first trend line (red) is formed using the first winning numbers
We will be using Lotto 6/49 as our example for explanations.
| 1 |
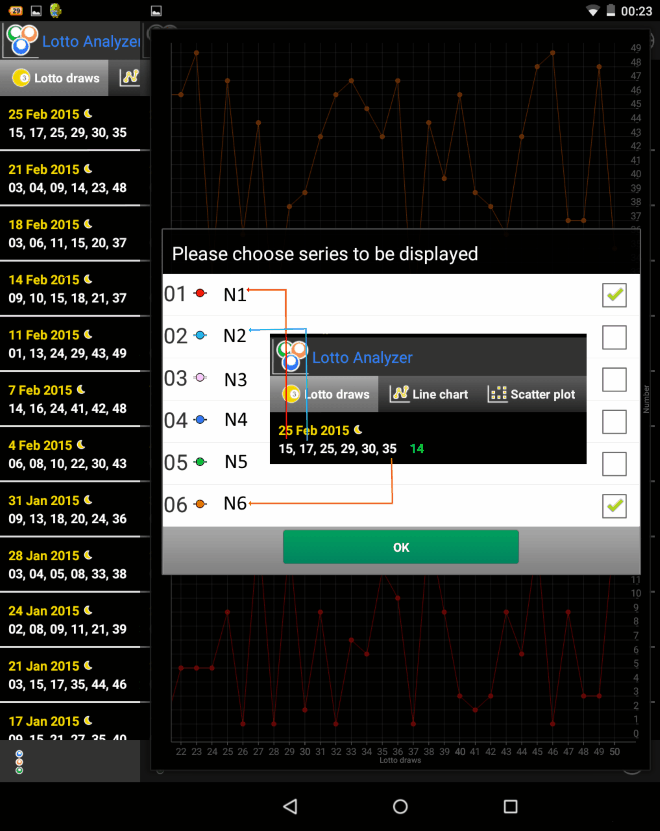
Using the line chart, we look at the trend for each of the winning numbers: first number (N1), second number (N2),
third number (N3), fourth number (N4), fifth number (N5), and sixth number (N6).
|
| 2 |
After looking at the trend (Line chart) for each number, you write 6 intervals with your expected numbers for next time (N1, N2, N3, N4, N5, N6) based on the line chart.
Example:
- I expect the first winning number (N1) to be in the interval [1-7] .
- I expect the sixth winning number (N6) to be in the interval [44-49].
|
| 3 |
After you have written your 6 intervals with your expecting winning numbers, you go to the scatter plot to look at the pattern for each number in your intervals.
|
PATTERNS using the Scatter Plot
|
In the scatter plot, the numbers are assigned colors as follows: |
Numbers in the interval [ 01 - 09 ] red;
Numbers in the interval [ 10 - 19 ] cyan;
Numbers in the interval [ 20 - 29 ] fuchsia;
Numbers in the interval [ 30 - 39 ] blue;
Numbers in the interval [ 40 - 49 ] light green;
|
|
The grouping by colors make the interpretation of the graphs easier and, in the same time, it is used in the structure tab that is explained below.
|
| 4 |
Take the first number interval N1:[1-7], from the example above, and look at each number from the interval on the scatter plot to see if any of those numbers are following a certain pattern and are more likely to be drawn.
You can look for patterns vertically, down the yellow lines. There will be lottery games (KENO is one example), where you will notice patterns also in a horizontal and diagonal direction.
For example in this interval [1-7], based on the pattern, I would say that numbers 2, 5 and 7 are more likely to appear. |
| 5 |
Once you have narrowed your numbers down within your intervals, you can look at the frequency/delay graph and further analyze the numbers you have chosen.
|
FREQUENCY / DELAY using the Bar Graph
|
In the bar graph, the numbers are assigned colors as in the Scatter Plot. |
|
The frequency is showing how many times each number appeared since the last entry you made and it is above x-Axis.
|
|
The delay is showing how many times the number did not appeared since the last entry you made and is below the x-Axis. The delay is represented by a negative number. |
| 6 |
We further analyze the numbers in the interval N1:[1-7] from the example above.
We can check the frequency and delay of 2, 5 and 7 that we selected when we analyzed the scatter plot.
At this time, the decision will be made based on the observations specific to the lottery game and unique to each user.
In my case I will choose 2 and 5 for the N1 interval and eliminate 7. Although 7 has a higher frequency than 2 and 5 (+1) the delay is much higher.
I learned from my experience that it's better to avoid the numbers that don't appear for a long time, but of course, it depends on each individual experience.
|
| 7 |
Continue the analysis for the remaining intervals for N2, N3, N4, N5, N6. Once you have narrowed your numbers down within your intervals, you can further analyze the structure of the lottery numbers by groups. See below.

|
STRUCTURE and REAPPEARANCES
|
In the structure tab the winning numbers are assigned colors as in Scatter plot. |
|
We can see the difference in information when we look at the numbers written in white and the numbers that have assigned colors.
|
|
By assigning colors we can notice the trend between groups and how they increase or decrease in time.
|
The numbers that are reoccurring are underlined and the total of reoccourring numbers is written in the brackets.
This number (reappearances) can be useful when we decide what numbers to play. For example if we notice that the number of reoccurring numbers is 0 or 1 we can eliminate the previous numbers all together when we decide what to play. On the contrary, if we notice that there are many numbers reoccurring, like in Keno or similar, we can use a combination of these numbers when we play.
|
| 8 |
Now we look at the structure and we notice that first interval [01 - 09] was absent in the last draw and looking at the previous draws we can conclude that next time there will be at least one number in that interval [01-09].
We can also notice that last interval [40-49] was missing or only appeared once on February 21 so there is chance that 2 or 3 numbers will appear this time in that interval.
Many times, we can notice that when numbers do not appear in a certain interval for a longer period of time, we can expect that more numbers will appear from that particular interval.
|
| 9 |
Let’s start to assume a few possible structures:
1 number in the interval [01-09]
1 number in the interval [10-19]
0 numbers in the interval [20-29]
I chose this because the interval appeared often and last time there were 2 numbers in this interval.
1 number in the interval [30-39]
3 numbers in the interval [40-49]
Another structure could be:
2 numbers in the interval [01-09]
0 numbers in the interval [10-19]
0 numbers in the interval [20-29]
1 number in the interval [30-39]
3 numbers in the interval [40-49]
|
| 10 |
We can make a few more structures if we feel like it but I would keep 3 numbers in the interval [40-49].
This method based on structure can help a lot in guessing the numbers if we can estimate it correctly, but again it won’t always be easy and we have to pay attention to the trend of each lottery game very carefully.
Now depending on the numbers we selected in the previous steps we can decide what number to keep and what numbers to eliminate and we can start writing some variants keeping in mind the structures we assumed. This will depend on each player experience and the particularities of each lottery.
Good Luck!
![]()
|